The Chrome DevTools is a web developer’s best friend and it has a ton of tricks and not-so-obvious features that not everyone is aware of.
Most developers know about the basics, like how to inspect elements on the page, but there is much more functionality hidden beneath its surface. The goal of this article is to demystify some of the most useful lesser-known features and show you what they can do for your development process.
Reference HTML elements
One of the lesser-known features of Chrome DevTools is the ability to reference HTML elements. This can be done in two easy steps:
-
Open the Chrome DevTools and navigate to the
Elementsview. -
Right-click on the element you want to reference and choose
Store as global variable.
Now you have the reference to the HTML element that you can access and inspect in your console.
Logpoints
Logpoints are a way of providing debug information to the console without having to resort to console.log(). I’ve been using Logpoints since I first heard about this feature, they allow me to clean up my codebase of the detritus of console.log statements.
You can add a new Logpoint by right-clicking any line in the sources tab of the DevTools and specifying an expression you’d like to log. When that line is executed, you’ll get its value in your console.
Live expressions
Live expression is a feature that shows the value of an expression as it changes. This is helpful for tracking down issues with costly expressions (like those used in animation) or those that change a lot (for example, if you’re iterating over an array).
All you need to do is click the Create live expressions button and specify the expression you’d like to monitor and then it will automatically show its value as it changes.
console.trace()
console.trace() is a utility that lets you know where a particular call was made to a certain function. Imagine you have an inner function that’s used in different places and is causing a problem. To eradicate the problem, you must first find out which location in your code calls it.
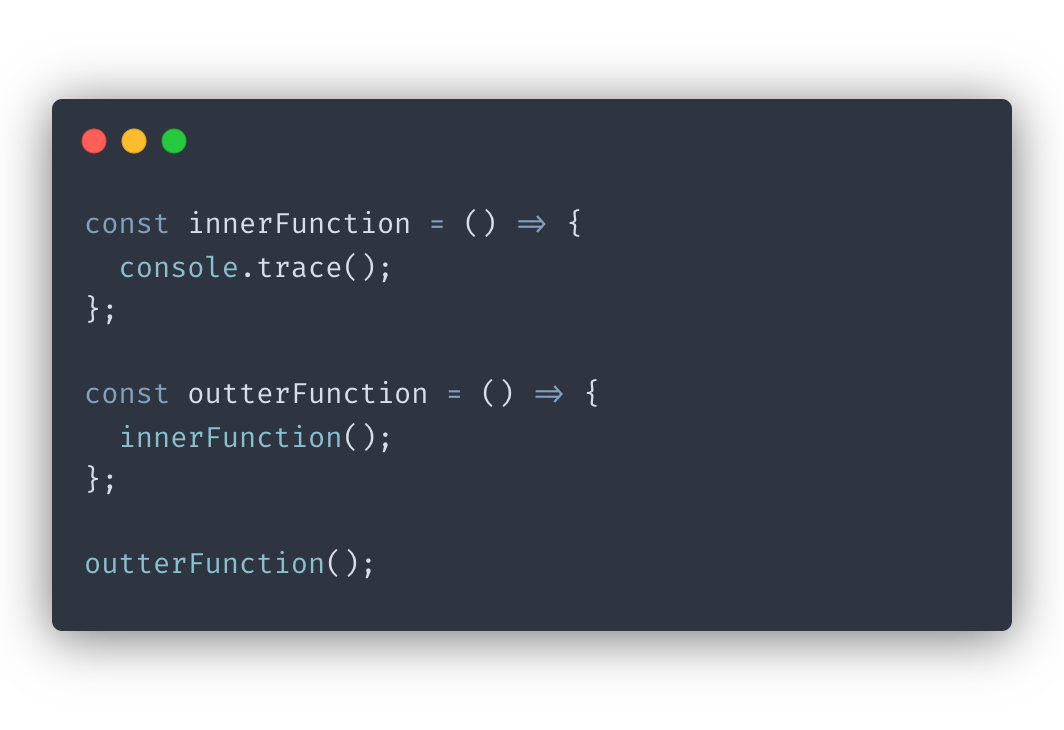
console.trace() provides this information so all you have to do insert it inside of the function you want to track.
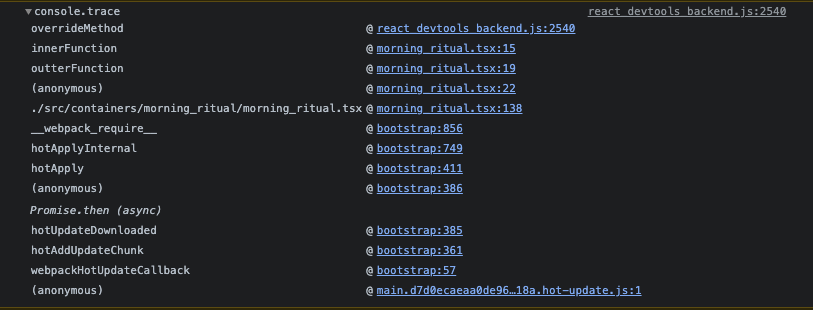
Notice how our stack trace shows that the call to innerFunction was preceded by a call to outterFunction.
This is a great way to troubleshoot issues and find out where exactly in your code things are breaking down.
Console utilities
Console utilities are an integral part of Chrome Dev Tools features. The Console Utilities API contains a collection of convenience functions for common tasks. You can read about them in more detail here .
Two very useful ones are $() and $$() which replace document.querySelector() and document.querySelectorAll() respectively. These return the node list you expect, and cast the results to arrays so you can use map() and filter().
Conclusion
These are just a few of the lesser-known Chrome DevTools features that can make your development process easier. With a little exploration, you’ll be able to find more tricks that help streamline your workflow.
If you’d like to get more web development, React and TypeScript tips consider
following me on Twitter,
where I share things as I learn them.
Happy coding!