
There are many tips for Chrome’s Dev Tools out there, but not all of them are useful for React. In this post, I cover five Dev Tools tips tailored for React development.
The list will be a mix of native Chrome Dev Tools features and handy extensions.
Printing component state to the console
If you’re working with React, you are probably using React Dev Tools daily. If you’re not, then you should. The extension helps you view and debug the state of your components.
Upon installing the React Dev Tools, you get two additional tabs in your dev tools, Components and Profiler. Both of them are valuable, but with totally different use-cases. We will cover the Profiler in a minute.
One thing you might not be aware of, though, is that you can print the state of your components to the console.
There are several reasons why you might want to do that. React Dev Tools don’t always display the full information about your components. In those cases, you can print the component state to the console to see more data. For example, take a look at this view:
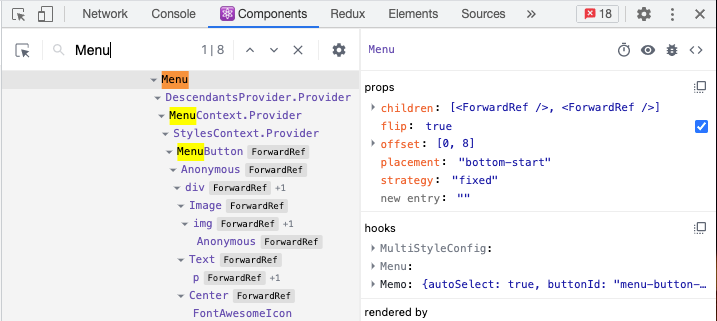
Say you want to see in more detail the children of the Menu component. Components debugger only shows that the children prop is an array of ForwardRefs. To take a closer look at the children, we can print the state of the Menu component using a special console command.
Select the component by clicking on it and type $r in the console.
Pro tip: To have both console logs and Components debugger in the same view, click the Esc button:
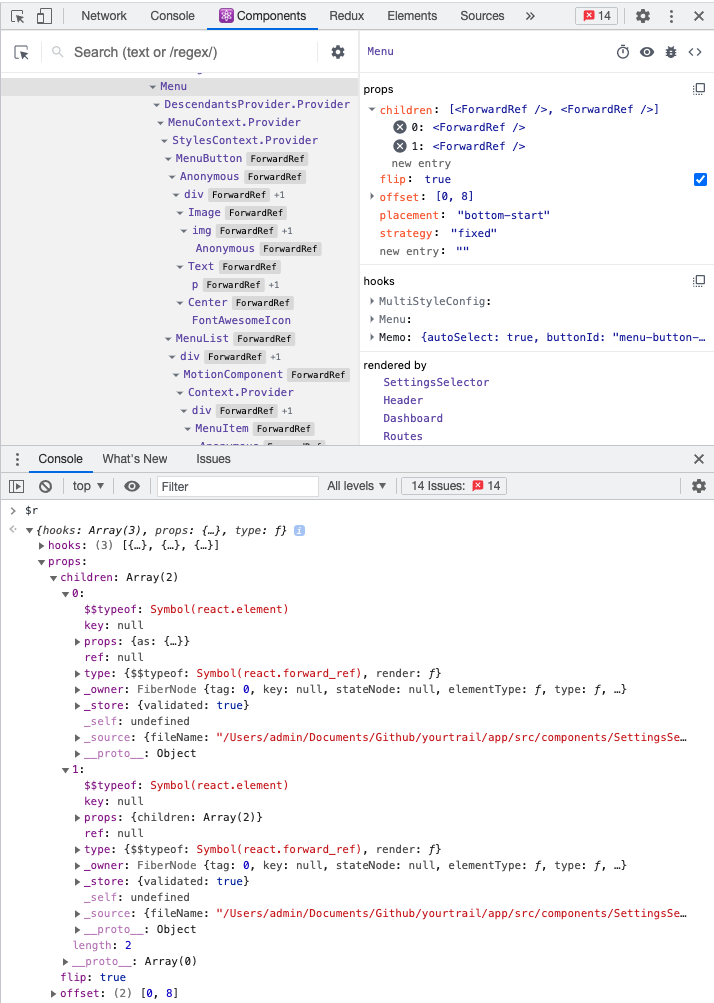
As you can see, we can expand and get more information about the children of the Menu this way.
Profiler
Profiler is one of your best tools when it comes to improving performance.
As I mentioned, it comes as a part of React Dev tools and allows you to track the renders of the components.
Getting started with it is simple. After installing React Dev tools, open up the Profiler tab and click on the Start Profiling button:
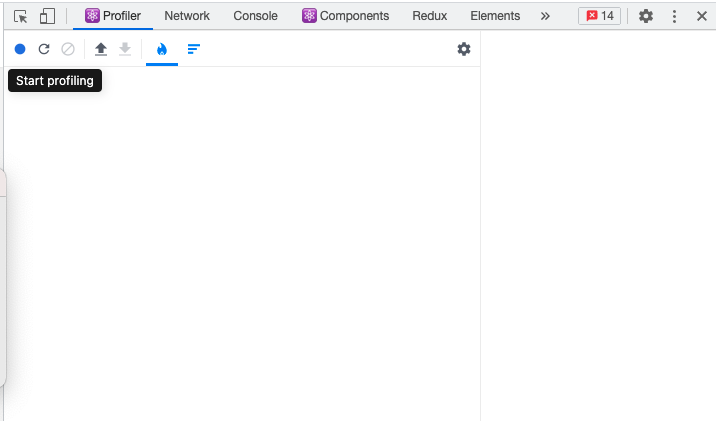
Now you can start interacting with your app to measure its performance. When you finish, click on the Stop profiling button. Here’s what you will see:
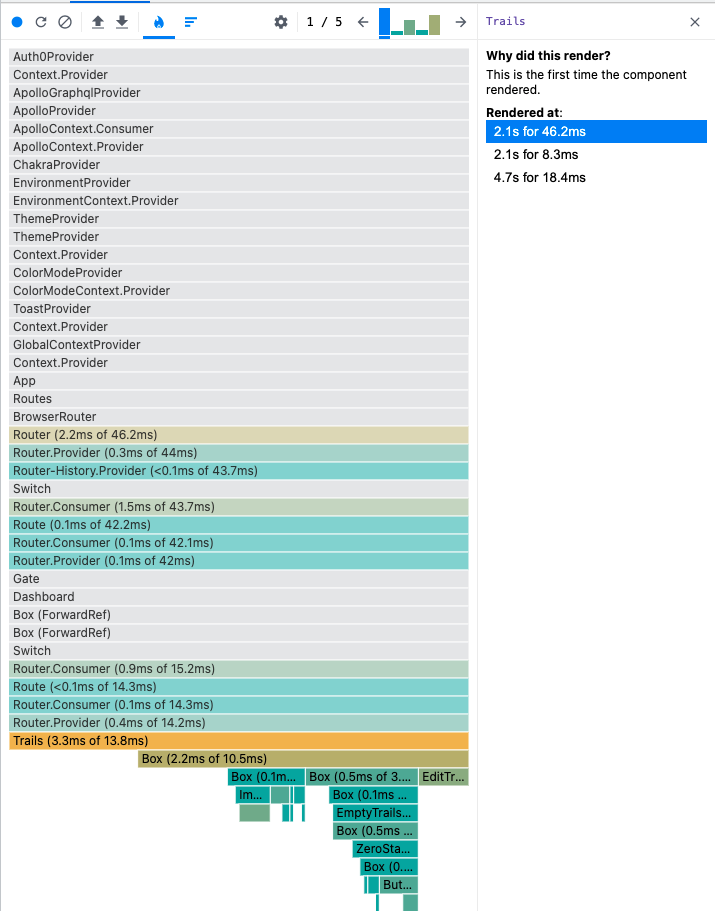
What you get is an interactive overview of the rendering activity of your component tree. Each component is colored according to the number of times it re-rendered while you were profiling. If it’s grey, it means it didn’t re-render at all during the interaction.
If you click on any component, the profiler will show the timestamp and the reason for each re-render.
If your React application has performance issues, that’s most likely due to redundant re-renders. In that case, use the Profiler to track down components that render more than necessary and work on lowering the number of re-renders. There are different tools you can use for optimization like
React.memo
,
useCallback
, and others.
Network Conditions
It’s important to test your React application against different network conditions. When you’re developing locally on a computer with a fast connection speed, things will run smoothly. That might make you miss edge-cases that users with worse connections will face.
More than half of the total amount of online users access their services through mobile devices. Usually, those devices have less than perfect connection conditions.
Luckily you can use the Network Conditions option in Dev Tools to simulate different connection speed:
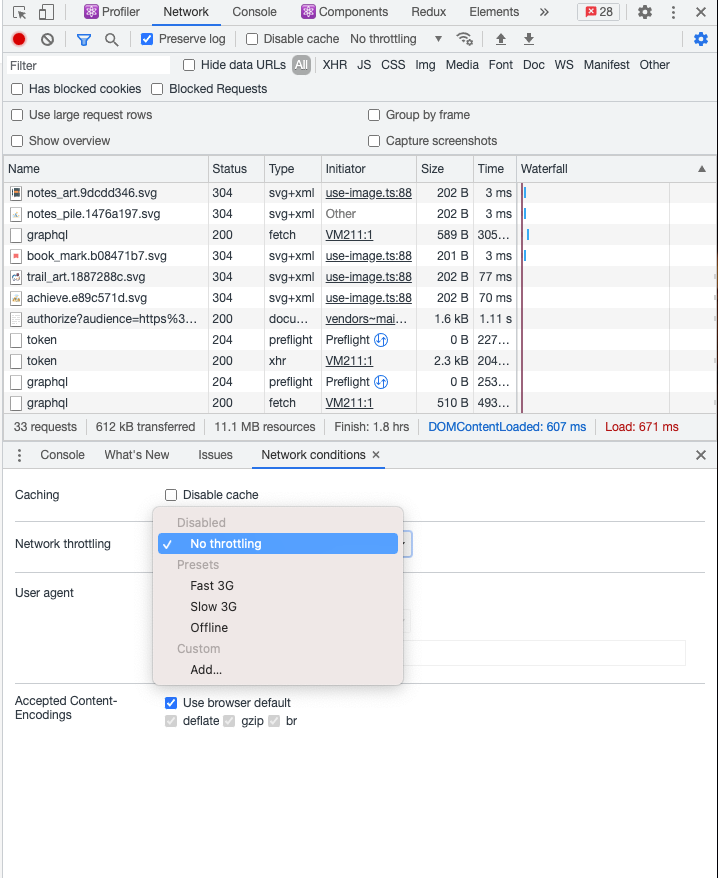
As you can see, it’s set to No throttling by default. To emulate slower network connections, you can use different presets or even create your own.
When building loading screens and other async interactions, it’s good to test them against at least a Slow 3G connection as well.
Custom Formatters
Custom formatters are hidden gems of Chrome Dev Tools. They give developers control over how objects look in the debugger and console.
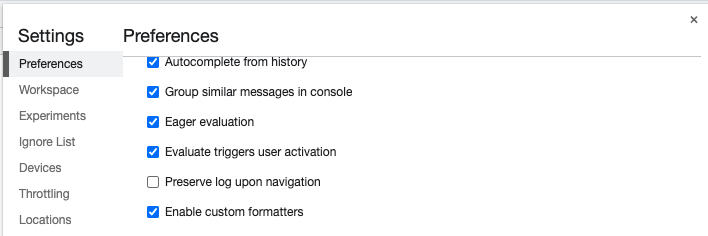
Custom formatters are disabled by default, so you will need to go to Settings -> Preferences and enable them:
So why use them? Well, you could write your own formatter for objects that are gnarly and hard to debug. One of the common use-cases for custom formatters is recursively displaying deeply nested objects. There are plenty of tutorials for writing custom formatters.
But for me, the main advantage is the extensions that are built on top of them. One great example of such an extension is
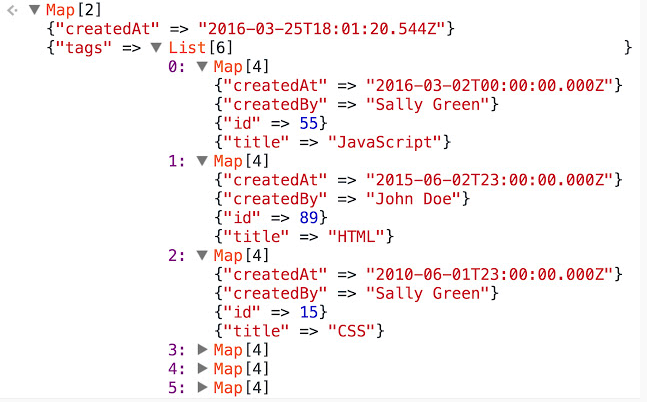
Immutable.js Object Formatter
. If you’ve worked with Immutable.js, you know how annoying debugging can get. The extension solves the problem by nicely formatting the immutable data structures you output to the console:
Apollo Chrome extension
This is a must-have extension for me if I’m working with GraphQL. If you install this extension, you’ll also get an additional Apollo tab in your Dev Tools. Here’s what it looks like
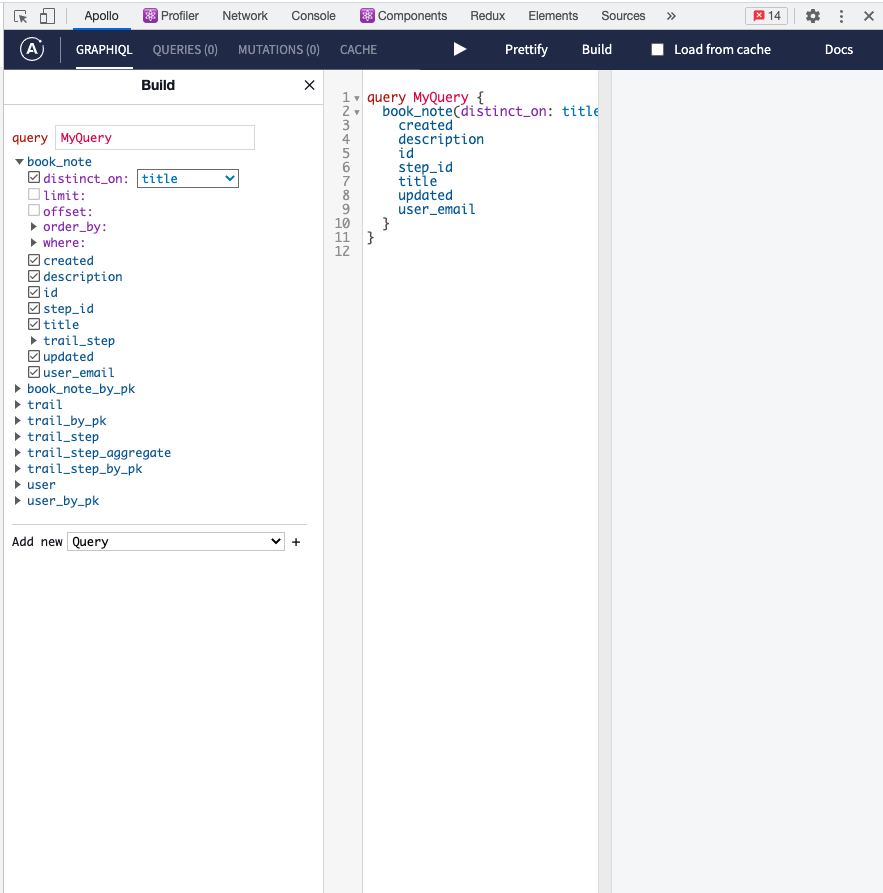
This interface will be familiar to you if you’ve ever worked with the
graphiql
editor. Clicking on the Build button opens up an interactive sidebar with all the available queries and mutations you can use.
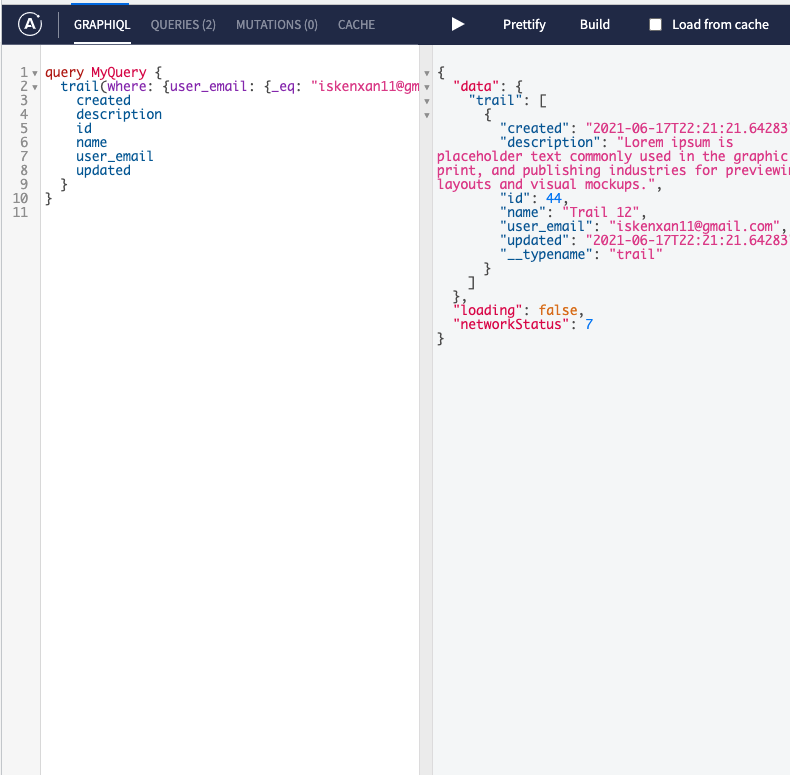
The best part is that the extension uses the current user session. That allows you to see how the queries execute with the current user’s permissions.
The downside of this extension, as you probably guessed by now, is that it only works with the Apollo GraphQL client.
Bonus: Redux Dev Tools
Initially, I did not list Redux Dev tools because, at this point, it’s hard to find a React developer that’s not aware of it. But it might be worth briefly mentioning for people who are new to React or Redux.
The extension makes it infinitely easier to work with Redux. It allows you to view all the triggered actions and their payloads in real-time, among many other features.
These are the top five Chrome Dev Tools tips that help me with my React work. I hope you found this list useful!
If you’d like to get more web development, React and TypeScript tips consider
following me on Twitter,
where I share things as I learn them.
Happy coding!